LabVIEW Tip - How to ensure you are displaying your waveform graph data accurately
13 February 2017
When writing data to waveform graphs and charts using LabVIEW, you need to be sure that the x-axis has been configured to match the units of time you wish to display.
This can be achieved by applying a multiplier to the x-axis. Find the multiplier by right clicking on the graph or chart and selecting ‘properties’ and navigate to the ‘scales’ tab.
Different sampling rates and time update intervals require different multipliers to ensure the data is displayed in the unit of time you require. To calculate the multiplier you apply the formula below:
Multiplier = no. of units of time per second / no. samples per second
Example
If you are sampling data at 1kHz and you want to display it in seconds, the multiplier would be calculated as follows:
Multiplier = 1 / 1000 = 0.001
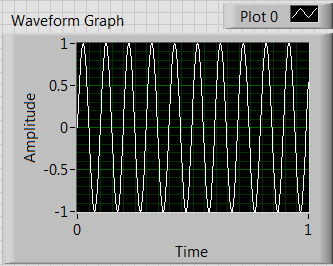
Figure 1 – graph displaying data sampled at 1kHz in seconds
For the same sampling rate, but displayed in milliseconds, the multiplier would be calculated as follows:
Multiplier = 1000 / 1000 = 1
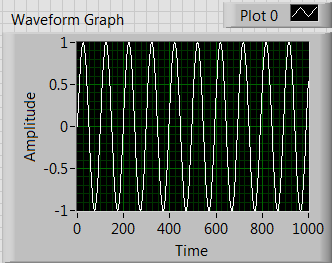
Figure 2 – graph displaying data sampled at 1kHz in milliseconds
Argenta host a quarterly User Group focused on LabVIEW and based in the Midlands, if you're interested, follow this link to the details of the next event.
Back to Blog listings